
This guide is part of our Current Real Estate Market Insights → [Current Real Estate Market Insights ]
Centennial’s real estate market has tilted toward buyers through measurable shifts in leverage: longer days on market, rising inventory, and more frequent price adjustments now give purchasers time and tools to negotiate effectively. These changes matter because they reduce the risk of overpaying in a southwest Denver suburb where strong schools, C-470 access, and stable employment draw consistent demand, allowing thoughtful buyers to secure long-term value amid Colorado’s elevated ownership costs. Sellers must adapt by prioritizing precise pricing and condition, while relocating homeowners can leverage these dynamics for smoother transitions.
Current Buyer Leverage Indicators in Centennial
Inventory in Centennial and the broader Arapahoe County area has climbed steadily, with active listings up significantly from pandemic lows, creating a buffer that extends decision timelines. Median days on market now hover in the 40–60 day range, up from under 20 days in prior peaks, signaling buyer selectivity rather than distress. This extension empowers buyers to compare options across neighborhoods like The Meadows or Heritage Eagle Bend without the frenzy of multiple-offer battles.
Price concessions have become routine: recent trends show 25–30% of listings with reductions, often 3–5% off original asks, as sellers respond to feedback from showings and open houses. For buyers, this translates to real savings—$15,000–$30,000 on a $700,000 home—that offset metro district taxes and insurance premiums heightened by the region’s weather exposure and wildfire proximity.
Why Leverage Shifts Favor Disciplined Buyers
In Centennial, buyer leverage stems from supply outpacing urgency, driven by homeowners reluctant to trade low-rate mortgages for current 6.5–7% levels. This “lock-in effect” slows new listings, but accumulated inventory still provides choice, particularly in family-oriented pockets with Littleton or Cherry Creek school access. Buyers who target homes active 30+ days capture 2–3 times more concessions, directly improving net costs in a market where total ownership exceeds mortgage payments by 25–35%.
Inventory Growth and Its Impact on Negotiation Power
Centennial’s inventory reflects Denver metro patterns: up 30%+ year-over-year in many segments, with single-family homes and townhomes leading the increase. This abundance means fewer homes sell above list—down to 15–20% from 40%+ peaks—shifting power to buyers who can walk away confidently.
For practical application, buyers should monitor REcolorado or DMAR data for submarkets: southeast Centennial near Dry Creek sees quicker absorption due to DTC proximity (10–15 minute drives), while northwest areas extend longer, offering prime negotiation windows. Relocators from higher-cost regions benefit most, as Centennial’s median prices ($650,000–$750,000) remain below Denver proper while delivering comparable amenities and commute reliability.
Days on Market Trends Driving Buyer Advantages
Extended DOM is the clearest leverage metric: Centennial homes now average 45–55 days to contract, with outliers at 70+ prompting aggressive seller responses. This trend matters because it allows thorough due diligence on housing stock—1970s ranches with potential foundation issues from expansive soils versus 2000s builds with efficient systems but higher HOA obligations.
Buyers gain from:
- Time for professional inspections uncovering deferred maintenance like roof wear from snow loads or HVAC strain in dry climates.
- Opportunities to request credits for updates, as sellers weigh carrying costs (mortgage, taxes, utilities) against prolonged exposure.
- Flexibility on terms, including rent-backs or delayed possession for seamless moves.
Sellers counter by staging for quick feedback, but data shows overpriced listings add 20–30 days, eroding equity.
Pricing Adjustments and Concession Patterns
Centennial’s market shows softening medians—down 1–5% year-over-year—concentrated in mid-range single-family homes, as buyers cap bids amid affordability pressures. Per-square-foot values hold steadier, indicating adjustments target condition and updates rather than broad devaluation.
Common leverage plays:
- Closing-cost credits: $8,000–$15,000 on 40+ DOM listings, covering rate buydowns or repairs.
- Inspection negotiations: Sellers cover 1–2% of price for non-structural items, avoiding appraisal gaps.
- Price reductions: Automatic after 21–30 days, averaging 4%, rewarding patient buyers.
These dynamics underscore why total cost analysis—factoring Arapahoe County taxes (1.1–1.4%), metro fees ($200–$500/month in newer areas), and insurance—determines true leverage.
Neighborhood Variations in Buyer Leverage
Centennial’s 15-square-mile footprint hosts distinct leverage pockets tied to commute paths and demographics:
High-Leverage Areas (Longer DOM, More Concessions)
Northwest Centennial (near Orchard and Holly): 50–65 DOM; older stock appeals to value buyers but demands scrutiny of sewer lines and windows. Ideal for negotiators targeting 1980s homes under $650,000.
Balanced Leverage Zones
Central corridors (Broadway to University): 35–50 DOM; strong light rail access to DTC balances inventory, favoring updated townhomes for first-move-up families.
Lower-Leverage Pockets (Quicker Sales)
Southeast prestige (The Meadows, Willow Springs): 25–40 DOM; premium schools and golf amenities sustain demand, but even here, extended time yields minor credits.
Commute realities amplify advantages: E-470 users reach DIA in 25 minutes, while C-470 links DTC in 10, prioritizing east-west flow over I-25 congestion.
Ownership Cost Realities Shaping Leverage Use
Colorado’s environment adds layers to buyer power: freeze-thaw cycles stress foundations, high sun exposure fades exteriors, and snow management inflates plowing/insurance. In Centennial, newer developments carry metro district bonds (paying off infrastructure over 30+ years), while older neighborhoods face capital calls for shared roofs or roads.
Buyers maximize leverage by:
- Requesting reserve studies for HOAs, revealing future assessments.
- Quoting utilities/insurance pre-offer, as premiums run 15–25% above national averages.
- Modeling 10-year costs: a $700,000 purchase at 6.75% yields $4,500 P&I; add $1,500 for taxes/insurance/HOA/maintenance.
Seller Strategies Amid Shifting Buyer Power
Sellers retain advantages in well-positioned homes but must preempt leverage loss:
- Price to 90–95% of comps, using 60-day sold data adjusted for condition.
- Pre-inspect and disclose, reducing post-offer friction.
- Offer incentives proactively on day-one listings to avoid DOM creep.
In buyer-favorable conditions, proactive sellers close faster, preserving net proceeds.
Visualizing Centennial’s Leverage Shift
The Denver metro’s inventory and DOM trends—up 30%+ and 40–60 days respectively—mirror Centennial patterns, as shown in prior metro charts
Inventory in Centennial and the broader Arapahoe County area has climbed steadily, with active listings up significantly from pandemic lows, creating a buffer that extends decision timelines. Median days on market now hover in the 40–60 day range, up from under 20 days in prior peaks, signaling buyer selectivity rather than distress. This extension empowers buyers to compare options across neighborhoods like The Meadows or Heritage Eagle Bend without the frenzy of multiple-offer battles.
Price concessions have become routine: recent trends show 25–30% of listings with reductions, often 3–5% off original asks, as sellers respond to feedback from showings and open houses. For buyers, this translates to real savings—$15,000–$30,000 on a $700,000 home—that offset metro district taxes and insurance premiums heightened by the region’s weather exposure and wildfire proximity.
Why Leverage Shifts Favor Disciplined Buyers
In Centennial, buyer leverage stems from supply outpacing urgency, driven by homeowners reluctant to trade low-rate mortgages for current 6.5–7% levels. This “lock-in effect” slows new listings, but accumulated inventory still provides choice, particularly in family-oriented pockets with Littleton or Cherry Creek school access. Buyers who target homes active 30+ days capture 2–3 times more concessions, directly improving net costs in a market where total ownership exceeds mortgage payments by 25–35%.
Inventory Growth and Its Impact on Negotiation Power
Centennial’s inventory reflects Denver metro patterns: up 30%+ year-over-year in many segments, with single-family homes and townhomes leading the increase. This abundance means fewer homes sell above list—down to 15–20% from 40%+ peaks—shifting power to buyers who can walk away confidently.
For practical application, buyers should monitor REcolorado or DMAR data for submarkets: southeast Centennial near Dry Creek sees quicker absorption due to DTC proximity (10–15 minute drives), while northwest areas extend longer, offering prime negotiation windows. Relocators from higher-cost regions benefit most, as Centennial’s median prices ($650,000–$750,000) remain below Denver proper while delivering comparable amenities and commute reliability.
Days on Market Trends Driving Buyer Advantages
Extended DOM is the clearest leverage metric: Centennial homes now average 45–55 days to contract, with outliers at 70+ prompting aggressive seller responses. This trend matters because it allows thorough due diligence on housing stock—1970s ranches with potential foundation issues from expansive soils versus 2000s builds with efficient systems but higher HOA obligations.
Buyers gain from:
- Time for professional inspections uncovering deferred maintenance like roof wear from snow loads or HVAC strain in dry climates.
- Opportunities to request credits for updates, as sellers weigh carrying costs (mortgage, taxes, utilities) against prolonged exposure.
- Flexibility on terms, including rent-backs or delayed possession for seamless moves.
Sellers counter by staging for quick feedback, but data shows overpriced listings add 20–30 days, eroding equity.
Pricing Adjustments and Concession Patterns
Centennial’s market shows softening medians—down 1–5% year-over-year—concentrated in mid-range single-family homes, as buyers cap bids amid affordability pressures. Per-square-foot values hold steadier, indicating adjustments target condition and updates rather than broad devaluation.
Common leverage plays:
- Closing-cost credits: $8,000–$15,000 on 40+ DOM listings, covering rate buydowns or repairs.
- Inspection negotiations: Sellers cover 1–2% of price for non-structural items, avoiding appraisal gaps.
- Price reductions: Automatic after 21–30 days, averaging 4%, rewarding patient buyers.
These dynamics underscore why total cost analysis—factoring Arapahoe County taxes (1.1–1.4%), metro fees ($200–$500/month in newer areas), and insurance—determines true leverage.
Neighborhood Variations in Buyer Leverage
Centennial’s 15-square-mile footprint hosts distinct leverage pockets tied to commute paths and demographics:
High-Leverage Areas (Longer DOM, More Concessions)
Northwest Centennial (near Orchard and Holly): 50–65 DOM; older stock appeals to value buyers but demands scrutiny of sewer lines and windows. Ideal for negotiators targeting 1980s homes under $650,000.
Balanced Leverage Zones
Central corridors (Broadway to University): 35–50 DOM; strong light rail access to DTC balances inventory, favoring updated townhomes for first-move-up families.
Lower-Leverage Pockets (Quicker Sales)
Southeast prestige (The Meadows, Willow Springs): 25–40 DOM; premium schools and golf amenities sustain demand, but even here, extended time yields minor credits.
Commute realities amplify advantages: E-470 users reach DIA in 25 minutes, while C-470 links DTC in 10, prioritizing east-west flow over I-25 congestion.
Ownership Cost Realities Shaping Leverage Use
Colorado’s environment adds layers to buyer power: freeze-thaw cycles stress foundations, high sun exposure fades exteriors, and snow management inflates plowing/insurance. In Centennial, newer developments carry metro district bonds (paying off infrastructure over 30+ years), while older neighborhoods face capital calls for shared roofs or roads.
Buyers maximize leverage by:
- Requesting reserve studies for HOAs, revealing future assessments.
- Quoting utilities/insurance pre-offer, as premiums run 15–25% above national averages.
- Modeling 10-year costs: a $700,000 purchase at 6.75% yields $4,500 P&I; add $1,500 for taxes/insurance/HOA/maintenance.
Seller Strategies Amid Shifting Buyer Power
Sellers retain advantages in well-positioned homes but must preempt leverage loss:
- Price to 90–95% of comps, using 60-day sold data adjusted for condition.
- Pre-inspect and disclose, reducing post-offer friction.
- Offer incentives proactively on day-one listings to avoid DOM creep.
In buyer-favorable conditions, proactive sellers close faster, preserving net proceeds.
Visualizing Centennial’s Leverage Shift
The Denver metro’s inventory and DOM trends—up 30%+ and 40–60 days respectively—mirror Centennial patterns, as shown in prior metro charts. This stabilization forecasts modest appreciation (2–4% annually) for quality assets, rewarding buyers who negotiate soundly.
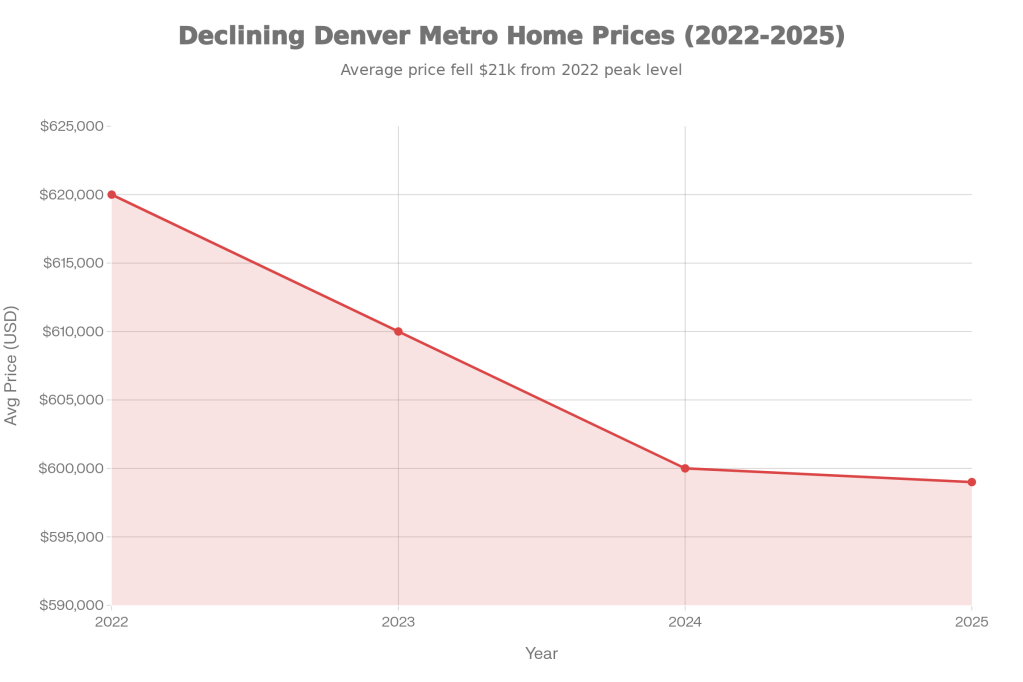
Denver Metro Average Home Price Trend, 2022–2025 (Approximate)
Long-Term Value in a Buyer-Leverage Market
Centennial’s fundamentals—proximity to 100,000+ DTC jobs, top-rated schools (District 12), and constrained land—sustain demand through cycles. Buyers leveraging current shifts build equity by acquiring functional homes (3+ beds, 2-car garages, main-floor offices) at rational prices, positioning for refi or resale in 7–10 years.
Moving Forward with Centennial Market Leverage
Centennial’s buyer leverage phase emphasizes strategy: extended timelines and concessions enable precise matching of properties to needs, commute patterns, and budgets in a resilient submarket. Thoughtful participants—buyers negotiating total costs, sellers pricing sharply—navigate effectively amid stabilizing trends.
Reach out to the authoring agent today for Centennial-specific leverage analysis, customized comps, and a data-driven plan tailored to your buying, selling, or relocation goals in this shifting market.


Why Pricing Strategy Matters More in a Balanced Market
This guide is part of our Current Real Estate Market Insights → [Current Real Estate Market Insights ] Centennial and the broader Denver metro have entered a balanced market where supply and demand align more closely, making precise pricing strategy the decisive factor between quick sales and prolonged listings. This equilibrium—marked by inventory levels up 25–40%…

How Interest Rate Movement Is Affecting Denver-Area Buyers
This guide is part of our Current Real Estate Market Insights → [Current Real Estate Market Insights ] Interest rate movements have reshaped the Denver-area housing market by altering affordability thresholds, slowing seller turnover, and handing buyers more leverage in negotiations. Current rates in the 6.5–7% range—more than double the lows of 2020–2021—directly impact monthly payments,…

Are Buyers or Sellers in Control Right Now? A Local Breakdown
This guide is part of our Current Real Estate Market Insights → [Current Real Estate Market Insights ] Denver metro real estate has reached a nuanced balance where neither buyers nor sellers hold outright control, but leverage tilts toward those who adapt to longer days on market, rising inventory, and selective pricing. This equilibrium matters because…

Leave a comment