This guide is part of our Current Real Estate Market Insights → [Current Real Estate Market Insights ]
Denver metro inventory levels have risen steadily across most submarkets, marking a shift from the ultra-tight conditions of recent years to a more balanced environment that favors deliberate decision-making. This increase—now approaching 3–4 months of supply in many areas—matters because it reduces bidding wars, extends negotiation windows, and allows buyers to prioritize long-term factors like commute reliability and ownership costs specific to Colorado’s climate and geography. Sellers face greater competition, while relocating homeowners gain flexibility in timing moves amid stabilizing prices.
Inventory Trends Across Key Denver Submarkets
Recent data from REcolorado and DMAR shows metro-wide active listings up 25–40% year-over-year, with single-family homes driving much of the growth as locked-in owners list selectively. This buildup correlates with longer days on market (40–60 days average) and fewer sales above list price, handing leverage to prepared buyers.
The pattern is not uniform: core urban areas like LoDo and Capitol Hill see modest gains due to persistent demand, while suburbs absorb larger increases tied to family relocations and new construction. For context, statewide trends mirror this, with Colorado’s inventory reaching decade highs in select regions, though Denver remains tighter than rural markets.
North Metro: Thornton and Westminster Dynamics
North metro inventory has surged, with active listings 30–50% above last year, reflecting spillover from pricier central areas. Homes here average 50+ days on market, giving buyers time to evaluate I-25 commute flows to downtown (25–35 minutes peak) and older housing stock prone to foundation settling from clay soils.
This abundance favors value seekers: townhomes and 1980s ranches trade concessions more readily, offsetting elevated property taxes (1.0–1.3% effective rates) and utility spikes from high-altitude heating needs.
Northeast Metro: Aurora and Commerce City Shifts
Aurora’s east-side neighborhoods lead with 35–45% inventory growth, bolstered by master-planned communities like The Aurora Highlands. Median days on market hit 45–55, enabling inspections for weather-stressed roofs and sewer lines common in 1970s builds.
Commerce City sees similar patterns, where E-470 access draws DIA commuters but extended supply prompts 4–6% price adjustments, improving affordability relative to Denver proper.
Central Denver: Slower Buildup, Persistent Demand
Core neighborhoods like Baker and Sunnyside show restrained inventory gains (15–25%), as urban appeal sustains quicker absorption. Even here, 35–45 DOM allows scrutiny of rowhome foundations and shared-wall maintenance, critical in freeze-thaw cycles.
Buyers benefit from choice in walkable pockets, though total costs—including higher insurance for dense zoning—demand precise budgeting.
South and Southwest Metro: Centennial, Littleton, Highlands Ranch
South suburbs exemplify the trend: Centennial and Littleton inventory up 30%, Highlands Ranch 25–35%, driven by family moves and C-470/DTC proximity (10–20 minute drives). Douglas County listings approach 4 months’ supply, with 50-day averages yielding frequent credits for HOA transfers and metro district fees ($200–$500/month).
Littleton’s older stock highlights risks: expanded inventory reveals deferred updates like windows fading from intense sun, inflating 10-year costs.
Southeast and East Suburbs: Parker and Castle Rock
Parker’s master-planned growth adds supply, pushing inventory 40% higher and DOM to 55 days, balancing demand from Meridian schools and Parker Road retail. Castle Rock sees parallel rises, where I-25 access to Centennial Airport aids relocators, but longer timelines expose HOA reserve shortfalls.
What Rising Inventory Means for Buyers
Greater choice across the metro reduces urgency: only 20–25% of homes sell over list now, versus 50%+ peaks. Buyers can target 30+ DOM listings for 2–3x more concessions, directly countering Colorado realities like Arapahoe/Douglas County taxes and insurance premiums 15–20% above national norms due to weather exposure.
Practical implications include:
- Time for multi-home comparisons on commute paths (e.g., light rail from Nine Mile to DTC).
- Negotiation room for rate buydowns on 6.5–7% loans, stabilizing payments amid utility volatility.
- Due diligence on housing eras: 1980s homes offer lots but demand foundation/sewer scopes; newer builds carry metro bonds.
Relocators from coastal markets find this shift ideal for matching budgets to functional layouts (3+ beds, garages, offices).
What Rising Inventory Means for Sellers
Competition sharpens: well-priced, updated homes still move in 20–30 days, but others linger, accruing costs ($1,500–$2,500/month including mortgage, taxes, upkeep). Metro-wide, 25–30% of listings reduce prices by 3–5%, often after 21 days.
Sellers adapt by:
- Anchoring to 60-day comps, adjusting for condition and micro-location (e.g., south-facing lots with better solar gain).
- Preempting objections: disclose maintenance on snow-load roofs or dry-climate HVAC strain.
- Offering incentives early to avoid inventory “staleness.”
In high-inventory suburbs, staging for family showings (open kitchens, fenced yards) sustains momentum.
Commute Patterns Influencing Inventory Absorption
Inventory distribution ties to transportation: C-470 corridors (Centennial to Highlands Ranch) absorb slower due to family selectivity, while I-225/E-470 (Aurora to Parker) sees quicker turnover from airport/tech jobs. Light rail extensions boost central/northeast supply, as transit users weigh longer DOM against parking savings.
Peak-hour realities—30–45 minutes to DTC from Littleton—prioritize east-west access, leaving north I-25 pockets with excess listings.
Housing Stock and Ownership Costs in a Higher-Inventory Market
Colorado’s built environment amplifies inventory effects: older metro homes (pre-1990s) face capital needs from freeze-thaw (foundations), sun exposure (siding), and snow (gutters/roofs). Newer suburbs add HOA/metro fees, visible now as buyers scrutinize reserves amid longer selection periods.
Total ownership modeling reveals why inventory empowers: a $650,000 Centennial home at 6.75% is $4,200 P&I; add $1,400 for taxes/insurance/HOA/maintenance—rising supply lets buyers negotiate offsets.
Visual Snapshot: Metro Inventory Growth
Denver metro inventory trends show steady climbs from 2023 lows, now at 3+ months’ supply in most submarkets, as captured in broader Colorado patterns
Recent data from REcolorado and DMAR shows metro-wide active listings up 25–40% year-over-year, with single-family homes driving much of the growth as locked-in owners list selectively. This buildup correlates with longer days on market (40–60 days average) and fewer sales above list price, handing leverage to prepared buyers.
The pattern is not uniform: core urban areas like LoDo and Capitol Hill see modest gains due to persistent demand, while suburbs absorb larger increases tied to family relocations and new construction. For context, statewide trends mirror this, with Colorado’s inventory reaching decade highs in select regions, though Denver remains tighter than rural markets.
North Metro: Thornton and Westminster Dynamics
North metro inventory has surged, with active listings 30–50% above last year, reflecting spillover from pricier central areas. Homes here average 50+ days on market, giving buyers time to evaluate I-25 commute flows to downtown (25–35 minutes peak) and older housing stock prone to foundation settling from clay soils.
This abundance favors value seekers: townhomes and 1980s ranches trade concessions more readily, offsetting elevated property taxes (1.0–1.3% effective rates) and utility spikes from high-altitude heating needs.
Northeast Metro: Aurora and Commerce City Shifts
Aurora’s east-side neighborhoods lead with 35–45% inventory growth, bolstered by master-planned communities like The Aurora Highlands. Median days on market hit 45–55, enabling inspections for weather-stressed roofs and sewer lines common in 1970s builds.
Commerce City sees similar patterns, where E-470 access draws DIA commuters but extended supply prompts 4–6% price adjustments, improving affordability relative to Denver proper.
Central Denver: Slower Buildup, Persistent Demand
Core neighborhoods like Baker and Sunnyside show restrained inventory gains (15–25%), as urban appeal sustains quicker absorption. Even here, 35–45 DOM allows scrutiny of rowhome foundations and shared-wall maintenance, critical in freeze-thaw cycles.
Buyers benefit from choice in walkable pockets, though total costs—including higher insurance for dense zoning—demand precise budgeting.
South and Southwest Metro: Centennial, Littleton, Highlands Ranch
South suburbs exemplify the trend: Centennial and Littleton inventory up 30%, Highlands Ranch 25–35%, driven by family moves and C-470/DTC proximity (10–20 minute drives). Douglas County listings approach 4 months’ supply, with 50-day averages yielding frequent credits for HOA transfers and metro district fees ($200–$500/month).
Littleton’s older stock highlights risks: expanded inventory reveals deferred updates like windows fading from intense sun, inflating 10-year costs.
Southeast and East Suburbs: Parker and Castle Rock
Parker’s master-planned growth adds supply, pushing inventory 40% higher and DOM to 55 days, balancing demand from Meridian schools and Parker Road retail. Castle Rock sees parallel rises, where I-25 access to Centennial Airport aids relocators, but longer timelines expose HOA reserve shortfalls.
What Rising Inventory Means for Buyers
Greater choice across the metro reduces urgency: only 20–25% of homes sell over list now, versus 50%+ peaks. Buyers can target 30+ DOM listings for 2–3x more concessions, directly countering Colorado realities like Arapahoe/Douglas County taxes and insurance premiums 15–20% above national norms due to weather exposure.
Practical implications include:
- Time for multi-home comparisons on commute paths (e.g., light rail from Nine Mile to DTC).
- Negotiation room for rate buydowns on 6.5–7% loans, stabilizing payments amid utility volatility.
- Due diligence on housing eras: 1980s homes offer lots but demand foundation/sewer scopes; newer builds carry metro bonds.
Relocators from coastal markets find this shift ideal for matching budgets to functional layouts (3+ beds, garages, offices).
What Rising Inventory Means for Sellers
Competition sharpens: well-priced, updated homes still move in 20–30 days, but others linger, accruing costs ($1,500–$2,500/month including mortgage, taxes, upkeep). Metro-wide, 25–30% of listings reduce prices by 3–5%, often after 21 days.
Sellers adapt by:
- Anchoring to 60-day comps, adjusting for condition and micro-location (e.g., south-facing lots with better solar gain).
- Preempting objections: disclose maintenance on snow-load roofs or dry-climate HVAC strain.
- Offering incentives early to avoid inventory “staleness.”
In high-inventory suburbs, staging for family showings (open kitchens, fenced yards) sustains momentum.
Commute Patterns Influencing Inventory Absorption
Inventory distribution ties to transportation: C-470 corridors (Centennial to Highlands Ranch) absorb slower due to family selectivity, while I-225/E-470 (Aurora to Parker) sees quicker turnover from airport/tech jobs. Light rail extensions boost central/northeast supply, as transit users weigh longer DOM against parking savings.
Peak-hour realities—30–45 minutes to DTC from Littleton—prioritize east-west access, leaving north I-25 pockets with excess listings.
Housing Stock and Ownership Costs in a Higher-Inventory Market
Colorado’s built environment amplifies inventory effects: older metro homes (pre-1990s) face capital needs from freeze-thaw (foundations), sun exposure (siding), and snow (gutters/roofs). Newer suburbs add HOA/metro fees, visible now as buyers scrutinize reserves amid longer selection periods.
Total ownership modeling reveals why inventory empowers: a $650,000 Centennial home at 6.75% is $4,200 P&I; add $1,400 for taxes/insurance/HOA/maintenance—rising supply lets buyers negotiate offsets.
Visual Snapshot: Metro Inventory Growth
Denver metro inventory trends show steady climbs from 2023 lows, now at 3+ months’ supply in most submarkets, as captured in broader Colorado patterns. This stabilization forecasts 2–4% appreciation for quality assets, benefiting strategic participants.
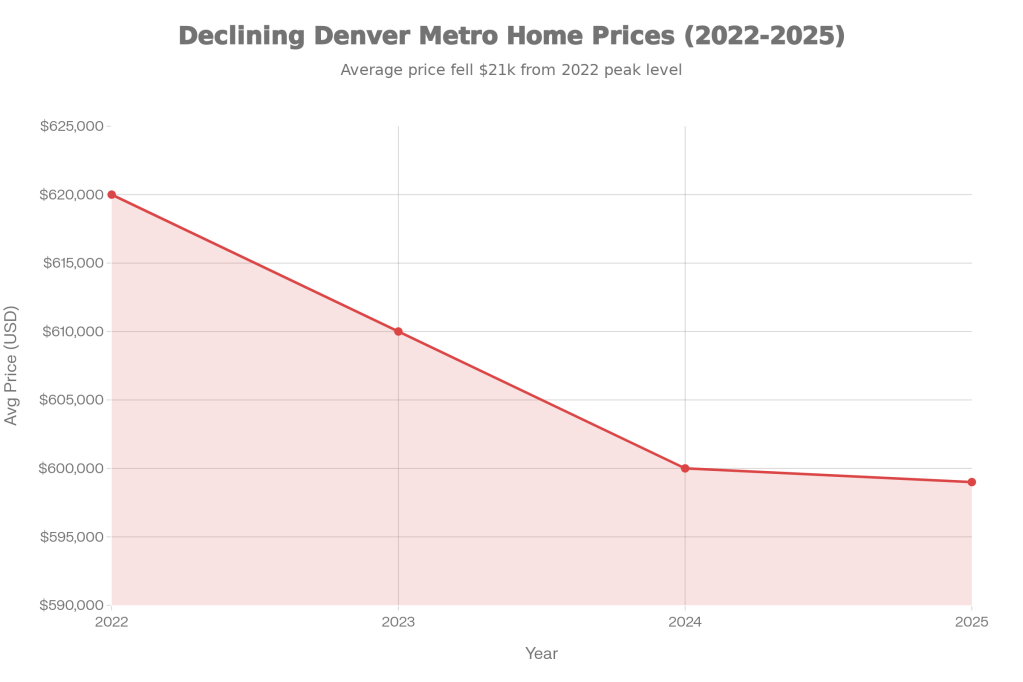
Denver Metro Average Home Price Trend, 2022–2025 (Approximate)
Long-Term Implications for Metro Value
Rising inventory tempers short-term gains but reinforces durability: constrained geography, job hubs (DTC, downtown), and schools sustain demand. Buyers securing homes now position for equity through cycles, while sellers timing listings avoid prolonged exposure.
Moving Forward Amid Changing Inventory
Across the Denver metro, elevated inventory creates a methodical market where preparation—data review, cost modeling, targeted negotiations—determines outcomes amid Colorado’s unique costs and commutes. This balance rewards buyers seeking value, sellers pricing sharply, and relocators aligning with submarket strengths.
Reach out to the authoring agent today for submarket-specific inventory reports, customized comps, and a tailored strategy to navigate these shifts in the Denver metro real estate landscape.


Why Pricing Strategy Matters More in a Balanced Market
This guide is part of our Current Real Estate Market Insights → [Current Real Estate Market Insights ] Centennial and the broader Denver metro have entered a balanced market where supply and demand align more closely, making precise pricing strategy the decisive factor between quick sales and prolonged listings. This equilibrium—marked by inventory levels up 25–40%…

How Interest Rate Movement Is Affecting Denver-Area Buyers
This guide is part of our Current Real Estate Market Insights → [Current Real Estate Market Insights ] Interest rate movements have reshaped the Denver-area housing market by altering affordability thresholds, slowing seller turnover, and handing buyers more leverage in negotiations. Current rates in the 6.5–7% range—more than double the lows of 2020–2021—directly impact monthly payments,…

Are Buyers or Sellers in Control Right Now? A Local Breakdown
This guide is part of our Current Real Estate Market Insights → [Current Real Estate Market Insights ] Denver metro real estate has reached a nuanced balance where neither buyers nor sellers hold outright control, but leverage tilts toward those who adapt to longer days on market, rising inventory, and selective pricing. This equilibrium matters because…

Leave a comment